

Bush’s 1995 hit, “Comedown”, is about ending a relationship and mourning the loss of the blissful parts that are now over, but also recognizing that they were not sustainable in the first place. Frontman Gavin Rossdale, who apparently could moonlight as a market psychologist, described the notion in a 2017 interview:
I liked the idea of euphoria. But having that euphoria has a comedown. It’s inside your brain and just says, ‘I’m having the greatest time, and I don’t want to stop.’ But most of the time, people lose that zone and it changes and you’re like, ‘No, I didn’t want this.’ And that’s such a common feeling.
“Having that euphoria has a comedown”…. This is certainly true for markets! Equity markets stumbled on Friday as investors learned that euphoria does, in fact, have a comedown, but we think Mr. Rossdale would agree with us that this comedown is a healthy and good development for this bull market.
“Why Did You, Why Did You, Why Did You”: 5 Reasons for Volatility
After a 9-week winning streak at a breakneck pace, we are not surprised to see some “digestion” of recent gains. We think we are seeing this volatility for 5 key reasons:
1. Market technicals were extended and losing steam at the same time, meaning we moved very far, very fast to the upside, but there were brewing signs of exhaustion. We can measure this by looking at overbought conditions with relative strength indices (on both daily and weekly measures) and comparing them to fading momentum indicators like the MACD (which has been moderating since mid-May, despite the new highs). All three charts are shown below.
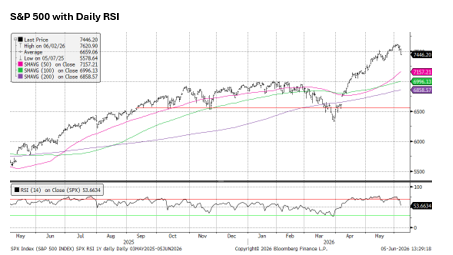
Source: Bloomberg, NewEdge Wealth, as of 6-5-26
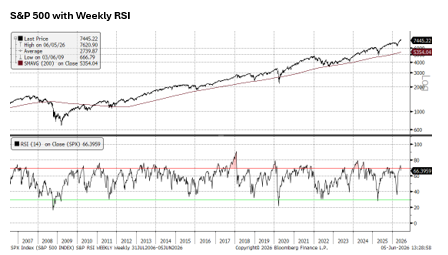
Source: Bloomberg, NewEdge Wealth, as of 6-5-26
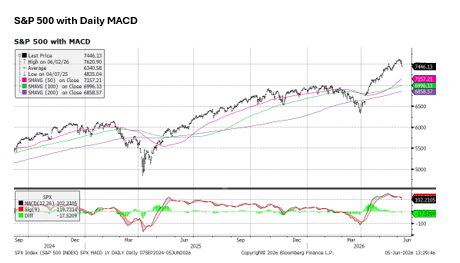
Source: Bloomberg, NewEdge Wealth, as of 6-5-26
2. Positioning for large-cap U.S. equities, and specifically mega-cap tech, became aggressively overweight. The chart below shows this breakdown from Deutsche Bank, highlighting how large-cap tech positioning is now in the 95th percentile, raising questions about who can be the incremental buyers (mostly as we are seeing a surge in equity supply with IPOs and existing listing issuance).
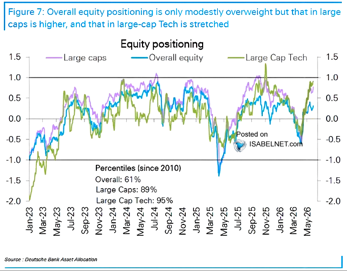
As of 6-4-26
3. Signs of aggressive risk-taking in options markets (investors clamoring for upside optionality and having little demand for downside protection) and huge rallies in the lowest quality portions of the market are not great timing tools for calling a near-term top (as we have written about frequently, silliness can persist). However, when we do see these signs of unbridled risk appetite, we see it as a sign of growing fragility under the surface, as high beta/low quality/high momentum leadership can quickly unwind (which is exactly what we saw Friday, as seen in the chart below with the Goldman Sachs Unprofitable Tech Index).
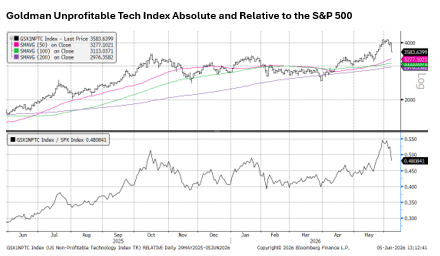
Source: Bloomberg, NewEdge Wealth, as of 6-5-26
4. The valuation reset that drove the huge move in semiconductor stocks (which have been the key driver of upside in the S&P 500, given their 92% rally off of the March lows and 19% weight in the S&P 500) had run its course. Semiconductor strength has certainly been driven by huge earnings growth, but it is important to appreciate that this earnings growth reset came prior to the strength in the stocks, with that 92% rally off the March lows coming for multiple expansion as valuation rebounded from recent lows (effectively the stocks got “cheap” as prices remained flat as earnings estimates were soaring, but now the stocks are no longer cheap after the recent vault higher). The chart below shows this dynamic, with the SOX Semiconductor PE ratio falling from 26x to 17x earlier in the year as earnings soared. This was followed by a valuation rebound to 28x, nearly the 2025 valuation peak.
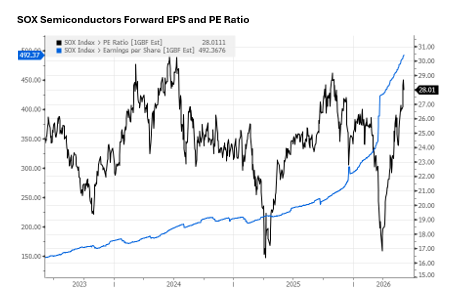
Source: Bloomberg, NewEdge Wealth, as of 6-5-26
5. Economic data is boxing the Fed into a less friendly and potentially more adversarial stance, sending yields higher as the odds of Fed rate hikes increased (with the bond market now implying a 100% chance of a hike by December). Friday’s better-than-expected jobs data (172k jobs added vs. 88k consensus, with positive 93k two-month revisions and a 4.3% unemployment rate) sent two-year Treasury yields up over 10 bps on the day to a new high for 2026 and 40 bps above the current Fed Funds rate as seen in the first chart below.
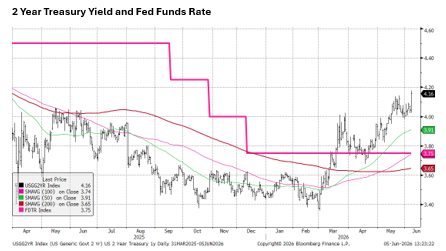
Source: Bloomberg, NewEdge Wealth, as of 6-5-26
The big question going forward will be whether or not the market will interpret this hawkish Fed as a potential drain on liquidity and dampener of growth. The key metric to watch will be credit spreads, which capture the bond market’s potential consternation about growth. If credit spreads widen out materially, it could reflect expectations that this foe-not-friend Fed will weigh on growth. Note in the second below, this widening has not occurred.
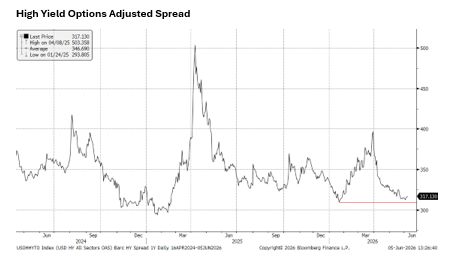
Source: Bloomberg, NewEdge Wealth, as of 6-5-26
“She Cut Me Right Back Down to Size”: Conclusion
After such a powerful run off the March lows, mostly one driven by a narrow cohort of high beta/high momentum stocks, we should not be surprised that we are seeing some “Comedown” from the huge gains. Though many will push back against these qualms about technicals, positioning, sentiment, valuation, and policy, citing ultra-strong earnings growth as reason to ignore these factors, as we showed over the last two weeks, there are nuances that investors should appreciate about the forward earnings picture as well (such as the huge benefit from one-time gains in 1Q26 and the likely-unsustainable surge in semiconductors margins over the medium-term). This creates an earnings backdrop that remains robust in the near-term, but should be examined closely for deceleration into 2027. All of this is to say that we do continue to see a bull market in stock prices, driven by robust earnings, but that we also see a healthy “Comedown” (thanks, Gavin) driven by technicals, positioning, sentiment, valuation, and policy.
IMPORTANT DISCLOSURES
The views and opinions included in these materials belong to their author and do not necessarily reflect the views and opinions of NewEdge Capital Group, LLC.
This information is general in nature and has been prepared solely for informational and educational purposes and does not constitute an offer or a recommendation to buy or sell any particular security or to adopt any specific investment strategy.
NewEdge and its affiliates do not render advice on legal, tax and/or tax accounting matters. You should consult your personal tax and/or legal advisor to learn about any potential tax or other implications that may result from acting on a particular recommendation.
The trademarks and service marks contained herein are the property of their respective owners. Unless otherwise specifically indicated, all information with respect to any third party not affiliated with NewEdge has been provided by, and is the sole responsibility of, such third party and has not been independently verified by NewEdge, its affiliates or any other independent third party. No representation is given with respect to its accuracy or completeness, and such information and opinions may change without notice.
Investing involves risk, including possible loss of principal. Past performance is no guarantee of future results.
Any forward-looking statements or forecasts are based on assumptions and actual results are expected to vary from any such statements or forecasts. No assurance can be given that investment objectives or target returns will be achieved. Future returns may be higher or lower than the estimates presented herein.
An investment cannot be made directly in an index. Indices are unmanaged and have no fees or expenses. You can obtain information about many indices online at a variety of sources including: https://www.sec.gov/answers/indices.htm.
All data is subject to change without notice.
© 2026 NewEdge Capital Group, LLC
The post Comedown appeared first on NewEdge Wealth.