


This week we are recapping a historic second quarter for global equity markets and taking a closer look at the recent FTSE/Russell index reconstitution. While it happens every six months, this cycle’s index rebalancing, measured by total market cap movement and the number of companies migrating between indices (between large and small, and growth and value) is the largest on record.
Given it is graduation season (for both students and many companies entering new indices), a fitting song for this week’s piece is the 1997 Green Day hit Good Riddance (Time of Your Life), a song about reflecting on the past and moving forward. While we are not suggesting investors say “good riddance” or move on from equities, the recent performance and lofty enthusiasm for certain segments, combined with increased scrutiny around AI capex trends and monetization (as our CIO Cameron Dawson pointed out last week), has created a more complicated environment going forward.
The second quarter was, as lead singer Billie Joe Armstrong said, “something unpredictable,” and while we don’t know if “in the end it’s right”, in our view closing the door on the quarter with “I hope you had the time of your life” alludes to some historic performance trends, and the possibly that conditions that have supported this recent performance may be changing as we turn to the second half of the year.
Source: Bloomberg, NewEdge Wealth. Data as of 6/30/26
“For What It’s Worth, It Was Worth All the While”: A Look Back at the Second Quarter
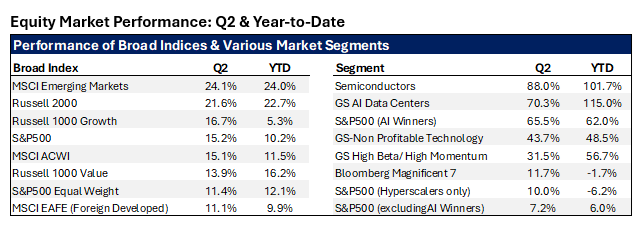
The second quarter for global equity investors was a historic one by many measures. While the MSCI All Country World Index returned a robust 15% (notching its best quarter since Q4 of 2020), the quarter will be remembered for the performance and enthusiasm for companies leveraged to the generational AI infrastructure build-out. This performance, driven by a combination of earnings momentum and increased investor risk appetite, helped fuel a historic stretch of gains during the quarter, where the S&P 500 posted nine consecutive weekly gains and a cumulative return of 17% from early March to early June. This streak and level of return ranks as the second-best for the index since 1950 and helped fuel the best quarter for many equity market segments in six years.
While weekly winning streaks for broad indices are not unusual in secular bull markets, the duration of this streak and the overall performance for the S&P 500 for the quarter were notable, evidenced by the fact that the S&P 500’s total return of 15% ranks in the 93rd percentile of quarterly performance since 1950.
While we continue to see earnings momentum as a key pillar of fundamental support for equity markets going forward, we acknowledge that the second quarter saw a confluence of positive tailwinds for equities (and a potential pull forward of performance). Combined with the seasonal volatility we typically see during the summer months, this may lead to some digestion and consolidation as we begin the second half of the year.
“So Make the Best of This Test and Don’t Ask Why”: Sentiment, Crowding and Style Attribution
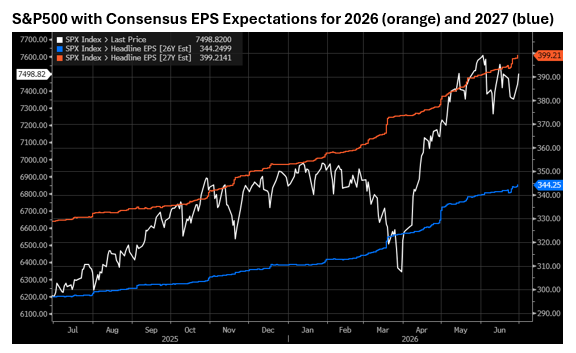
The dominant driver of equity market performance during the quarter was underlying earnings momentum, both in reported earnings growth (surpassing 20% YoY for the first quarter) and in estimates for earnings growth for the coming years (referred to as positive earnings revisions). Despite a more turbulent macro environment, including an oil price shock that would typically be associated with lower economic and earnings growth, EPS growth estimates for 2026 and 2027 surprisingly increased by more than 6% over the course of the second quarter.
Source: Bloomberg, NewEdge Wealth as of 6/30/26
While the earnings momentum fueled risk appetite and investor sentiment in Q2, the underlying composition of earnings growth was largely concentrated in three industry groups, all of which are beneficiaries of AI-related capex (semiconductors, capital goods, and technology hardware and equipment). Combined, these three industry groups accounted for 65% of the S&P 500 return for the quarter, a function of both optimism around the pace of AI capex growth and lingering macro headwinds to the average company from higher interest rates and upward pressure on inflation.
These trends resulted in a highly bifurcated equity market in which AI plays outperformed non-AI plays by nearly 60% during the quarter. Semiconductors, for example, the largest beneficiaries of AI capex, posted a record quarter and returned 88%. At the same time, the average S&P500 company returned just 11%, and the hyperscalers (the companies making the investments in AI infrastructure) actually lagged and returned 10%, with notable weakness in June to close out the quarter.
In addition to this bifurcation, we saw more speculative areas like non-profitable tech and indices comprised of companies with the highest trailing momentum return over 40%, both of which reflect elevated risk appetite, investors gravitating towards top-performing companies, and optimism about a sustained acceleration in many cyclical areas.
Overall, this bifurcation contributed to narrower performance and a market of haves and have-nots, evidenced by the fact that just 10 companies (comprising 32% of the S&P 500 index) accounted for more than 60% of the index return during the quarter. At the same time, just 30% of companies outperformed the index and 33% declined during the quarter.
“Another Turning Point, a Fork Stuck in the Road” – Index Reconstitution and the Style Blurring of the Magnificent Seven
Following a remarkable second quarter of performance and the bifurcation between the haves and have-nots which we have detailed, it shouldn’t be too surprising that the rebalancing of the FTSE/Russell indices has taken on greater significance this year.
Historically, the semi-annual reconstitution of the holdings and weights of the major FTSE/Russell indices garners headlines, results in modest institutional rebalancing, and leads to some front-running by investors looking to capitalize on investment flows. While these variables contribute to near-term price volatility (and volumes as a record number of shares traded for the combined NYSE and Nasdaq on 6/26), historically the effect has been modest and the volatility short-lived. The current index reconstitution, however, is notable for several reasons, primarily the magnitude of the changes and the continued blurring of lines between what have historically been well-defined market segments.
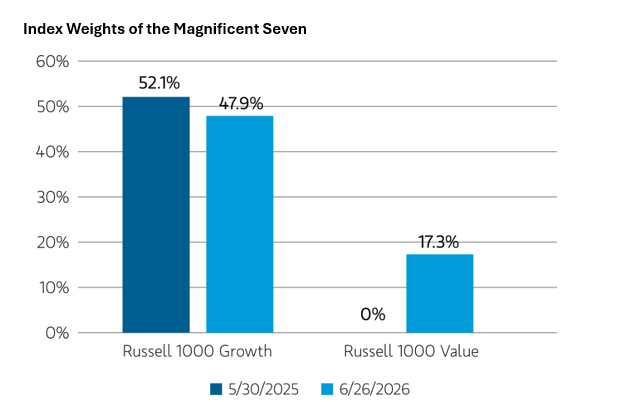
Starting with the Russell 1000 Growth and Russell 1000 Value indices, we are seeing a continued migration of Magnificent Seven capitalization from the Growth to Value style. This shift began a year ago when Alphabet, Meta Platforms, and Amazon were first classified as both Value and Growth, and as a result were included in both indices. In this year’s reconstitution, Alphabet is moving entirely back to Growth (after a relatively short stay in the Value world), discretionary heavyweight Amazon is moving almost entirely to Value, and tech giants Microsoft and Apple (historically two of the largest Growth companies) are seeing half of their index weight shift to the Value index. According to FTSE/Russell, these changes are driven by a proprietary formula which assigns companies to either the Growth or Value universe according to historical growth rates and current valuation, as well as their mandate to maintain an equal split in total large cap market capitalization between Growth and Value. The recent expansion in market capitalization of the largest Growth companies has ultimately raised the bar for what it takes to be a “Growth” company in their framework, which is resulting in many names drifting into the Value segment.
This phenomenon is most evident in the Magnificent Seven group, which as of early July is now a 17% weight in the Russell 1000 Value Index. This is a surprisingly large allocation to a group that has historically dominated the Growth index and has not exhibited many of the common traits of Value companies like slower growth, cyclicality, capital intensity, and operating leverage. This reclassification is, in part, a recognition that the many Magnificent Seven companies are more capital intensive today and are trading at valuation discounts relative to peers and recent history. While this does broaden the universe of potential investors in these names (as many Value managers now have to consider larger Mag7 allocations given their weight in the index), this shift also brings both the Russell 1000 Growth and 1000 Value indices closer together from a style standpoint. In our view this may reduce some of the diversification benefit an allocation to both segments has historically generated.
Source: FactSet. Data as of 6/26/26
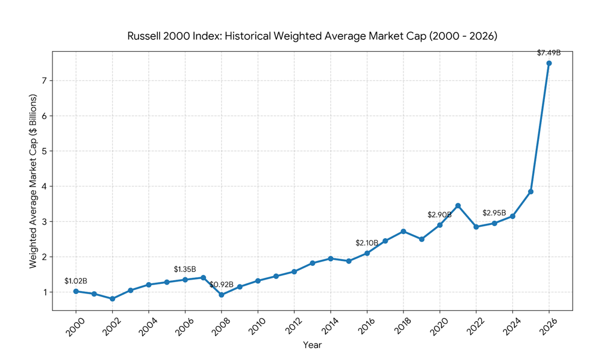
Looking at the large-cap and small-cap segments, we see a similar blurring of the lines. In total, 43 companies are graduating from the small-cap Russell 2000 index in this rebalance, a result of their recent performance and market cap growth. In addition, the maximum market capitalization for small-cap qualification continues to increase, now standing at $5.7B. This is an increase from the $1.0B maximum qualification that existed post the global financial crisis, and it is more than double the average maximum threshold of $2.9B since 2000. The weighted average market capitalization for the index has also continued to rise, reaching $7.5B by late June, which is up from $2.1B a decade ago. While equity market performance should lead market capitalization to rise over the long term, and the current rebalance will reduce this record level, we find it interesting that just 10 years ago a weighted average market cap of $7.5B would have been larger than 30% of companies in the large-cap S&P 500.
In the interest of time, we’ll save a deeper dive on the small cap segment for another day, but the overall takeaway is that the line between large and small cap indices is also becoming blurred and, once again, potentially watering down the diversification and style benefits many allocators are aiming to capitalize on.
Source: FTSE/Russell, NewEdge Wealth. Data as of 6/26/26
Finally, when evaluating the 43 companies graduating from the Russell 2000, we see many key beneficiaries of AI capex trends. This small cohort of AI infrastructure companies has largely carried the Russell 2000 Index this year, accounting for nearly half of the index total return. While active managers in the small cap segment without exposure to this cohort are likely saying “good riddance”, the reconstitution (similar to a championship team losing the majority of its best players) leaves the index searching for a new cohort of star contributors and at the same time, potentially less fundamentally attractive (as these graduates were also generating healthy earnings growth).
The key takeaway is that the small-cap index going forward will likely be more reliant on traditional drivers like easing financial conditions (lower rates and more abundant liquidity) and accelerating economic activity, both of which have been historical tailwinds for the small-cap segment.
“In the End, It’s Right?”: Looking Ahead to the Second Half of 2026
As we turn to the second half of the year, we see global equity markets at an interesting intersection. Following a historic second quarter, we are clearly in an environment of elevated enthusiasm for equities, enthusiasm that is most pronounced in highly cyclical areas, segments that have exhibited the strongest recent momentum, and those most leveraged to the AI infrastructure theme.
While underlying earnings momentum remains a key pillar of support, providing insulation from macroeconomic uncertainty and helping justify current valuations, in our view this environment warrants a more disciplined approach for the second half. Historically, crowded positioning, high leverage levels, lofty expectations, and historic outperformance from the high momentum segment have opened the door for rapid resets and resulted in periods of near-term consolidation or digestion.
While we remain constructive on equities, we believe investors should continue to prioritize those companies with durable earnings growth and use tools like rebalancing and diversification to their advantage (investing tools and a philosophy that we recently detailed in our whitepaper Quality Focused Investing at NewEdge Wealth: Part II). Lastly, we are closely watching the AI capex story as it continues to be the dominant driver of underlying earnings momentum. Any restraint from the hyperscalers (driven by a shift in the economics of compute or further weakness in their share prices), could lead to a resetting of earnings expectations for the AI capex beneficiaries, many of which have been the dominant contributors to equity market performance around the world.
IMPORTANT DISCLOSURES
The views and opinions included in these materials belong to their author and do not necessarily reflect the views and opinions of NewEdge Capital Group, LLC.
This information is general in nature and has been prepared solely for informational and educational purposes and does not constitute an offer or a recommendation to buy or sell any particular security or to adopt any specific investment strategy.
NewEdge and its affiliates do not render advice on legal, tax and/or tax accounting matters. You should consult your personal tax and/or legal advisor to learn about any potential tax or other implications that may result from acting on a particular recommendation.
The trademarks and service marks contained herein are the property of their respective owners. Unless otherwise specifically indicated, all information with respect to any third party not affiliated with NewEdge has been provided by, and is the sole responsibility of, such third party and has not been independently verified by NewEdge, its affiliates or any other independent third party. No representation is given with respect to its accuracy or completeness, and such information and opinions may change without notice.
Investing involves risk, including possible loss of principal. Past performance is no guarantee of future results.
Any forward-looking statements or forecasts are based on assumptions and actual results are expected to vary from any such statements or forecasts. No assurance can be given that investment objectives or target returns will be achieved. Future returns may be higher or lower than the estimates presented herein.
An investment cannot be made directly in an index. Indices are unmanaged and have no fees or expenses. You can obtain information about many indices online at a variety of sources including: https://www.sec.gov/answers/indices.htm.
All data is subject to change without notice.
© 2026 NewEdge Capital Group, LLC
The post Graduation Season appeared first on NewEdge Wealth.
