
I’ve been looking so long at these pictures of you
That I almost believe that they’re real
“Pictures of You” – The Cure
We continue to see this market for risk assets (equities and credit) as being underpinned by rising growth estimates.
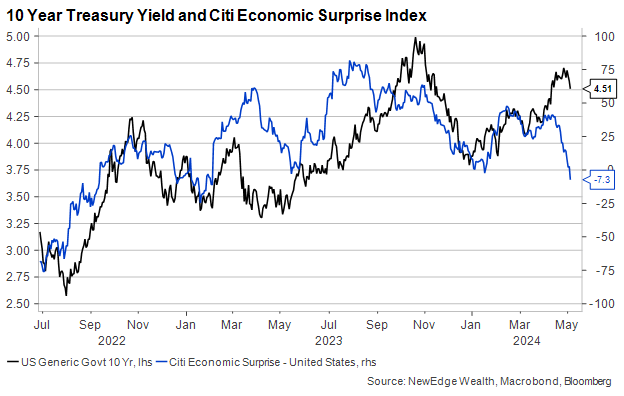
We have called the picture below as “the most important chart of the last two years”, as it captures how falling growth estimates contributed to the risk asset bear market of 2022 while rising growth estimates helped fuel/confirm the risk asset bull market of 2023 and into 2024.
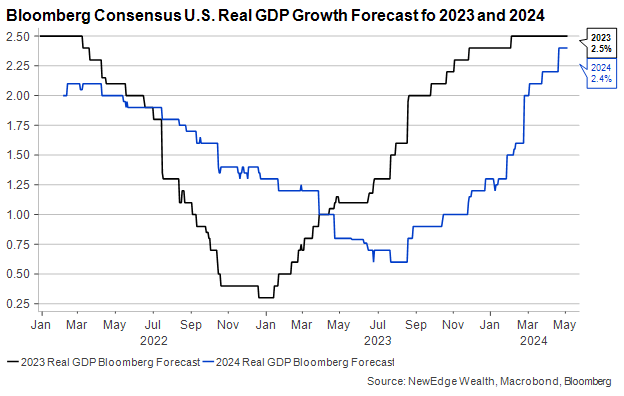
It is not industrious to say that growth matters for risk asset returns because, almost always, risk assets benefit when the picture of growth becomes rosier and struggle when the picture of growth becomes bleaker.
However, today, we could argue that this growth outlook is especially important for future market performance given the current starting point of valuations and yields, as seen with the S&P 500’s equity risk premium (the spread of the earnings yield over the 10 year treasury yield) at its lowest level since the 2000s tech bubble.
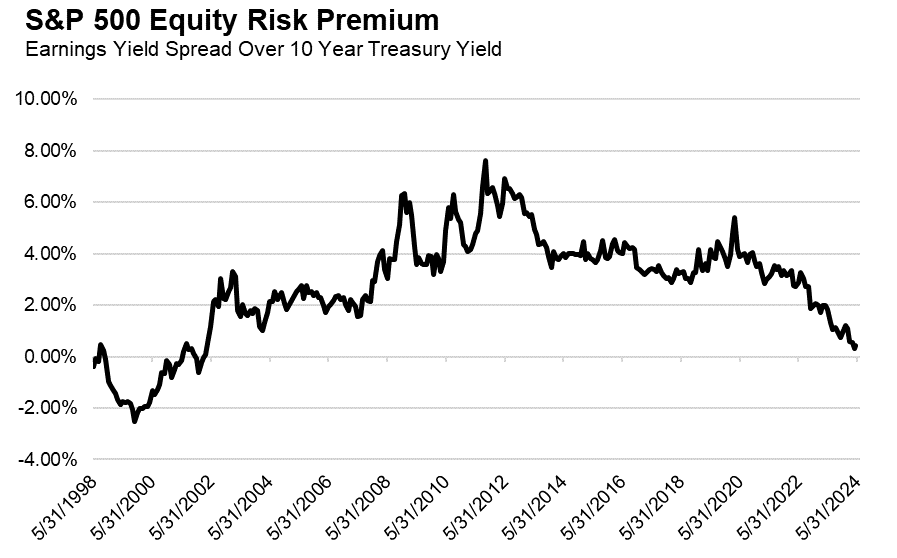
Of course, valuations are a poor timing tool in the short term, meaning elevated valuations can persist and not weigh on near term equity performance. Further, the modern constitution of the S&P 500, with its larger weights to high-quality, cash-generating companies, can demand higher valuations.
However, we do think this fulsome valuation creates an imperative for economic and earnings growth to continue to deliver (compared to times when valuations and expectations are very low, and the market can rally even on less-strong data) and for liquidity to remain supportive.
This imperative for rising growth estimates to continue to see market strength necessitates looking “so long” at these “pictures of growth” in order to gauge the trajectory of future forecast revisions.
“And you finally found all your courage to let it all go”: GDP Forecast Revisions
As the first chart showed, Wall Street economists finally found their “courage to let it all go”, as they rapidly raised estimates for 2023 and 2024 GDP growth over the past 18 months.
At this point, we think that growth estimates are far better calibrated to the current economic environment. Said another way, we see less potential for upside to consensus GDP growth forecasts now that they have been reset to a level that reflects a still-healthy economy, versus the recession fears expressed in prior forecasts.
If we are to see further upside to 2024 estimates, it could be seen in the 2H24 forecasts, where the Street has a notable deceleration in growth estimates compared to the first half. Some of this can be attributed to tougher year-over-year comparisons, as the 2H23 growth was stronger than 1H23, meaning this forecasted deceleration is reasonable and not reflective of a dire turn in sentiment.
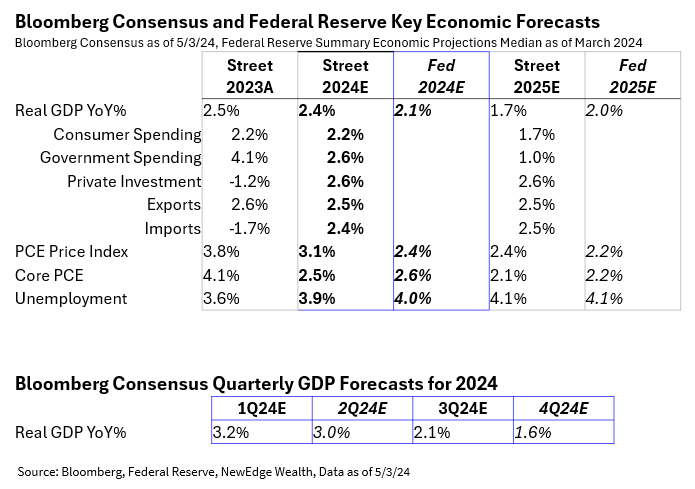
We also watch for potential upside to 2025 estimates, which currently have growth decelerating to 1.7%. As we progress closer to 2025, we will have to judge the reasonableness of this forecast (either to the upside or downside) based on the backdrop for the labor market, the health of the consumer, the state of business investment, the outlook for government spending, and more.
Thinking of the sources of potential upside drivers to GDP forecasts has been the right dream to dream over the past 18 months, compared to fears of weaker growth that have not materialized. However, given how much estimates have already been revised higher, we would be remiss in not thinking about what could drive 2024 and 2025 GDP forecasts lower.
We watch the consumer closely on this front, as a more-resilient consumer has been a key source of upside to GDP estimates (household consumption is 70% of GDP). This is why the equity market hangs on every piece of labor market data, as a still-healthy labor market also keeps consumer spending healthy.
We think an outright weak print in data like Nonfarm Payrolls could call into question the robustness of consumer spending forecasts, potentially lead to growth estimates being revised lower, and likely spark risk-asset weakness in an immediate reaction, even if Fed support is expected. The good news is that recent labor market data has “softened” or “normalized” but has not shown signs of outright, sharp weakness (though this softness has us on alert, as it could snowball into greater weakness, but that remains to be seen).
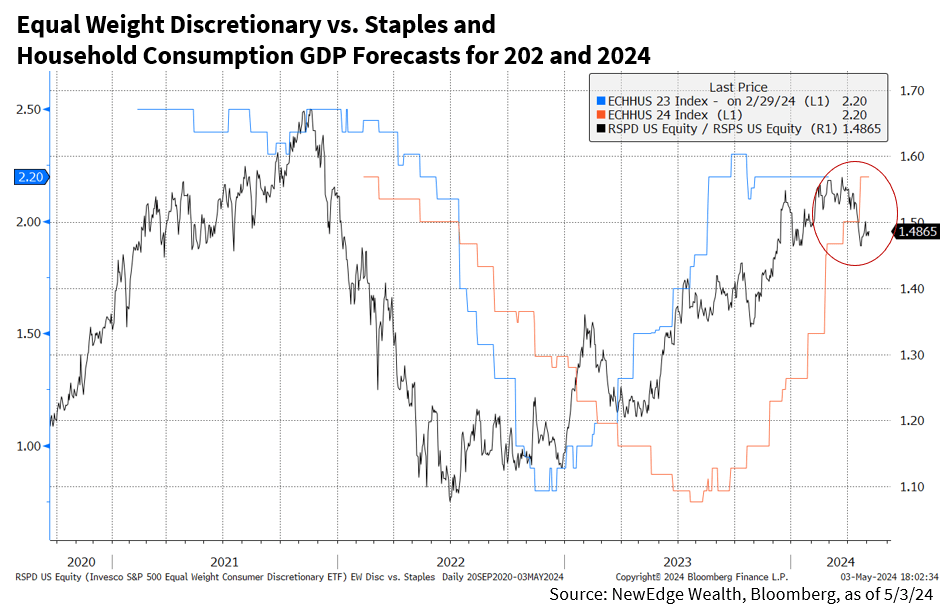
We continue to watch the consumer through the lens of the equity market, by tracking the relative performance of equal weight Consumer Discretionary versus Consumer Staples stocks. This ratio has stumbled recently, but it may be too soon to call a trend change. If this ratio does fall into a downtrend, it may be a harbinger of future cuts to consumer growth and, thus, GDP forecasts.
One last item to watch for potential GDP revisions lower is economic surprises, which have been coming in softer in recent weeks. Softer economic surprises (an index that measures how much incoming data is beating consensus forecasts) have not resulted in lower GDP forecasts in the past year but may do so going forward if they persist.
Overall, when it comes to GDP, we see less upside for GDP estimates to be revised higher but have yet to see data that suggests that GDP estimates will be cut swiftly and significantly. This suggests that rising forecasts may no longer be as big of a tailwind for risk assets, but falling forecasts are yet to emerge as a major headwind for risk assets (again, yet).
“You were always so lost in the dark”: EPS Forecast Revisions
One of the peculiar dynamics of the past 18 months is that even as GDP forecasts were being revised significantly higher, EPS forecasts for the S&P 500 were fairly static.
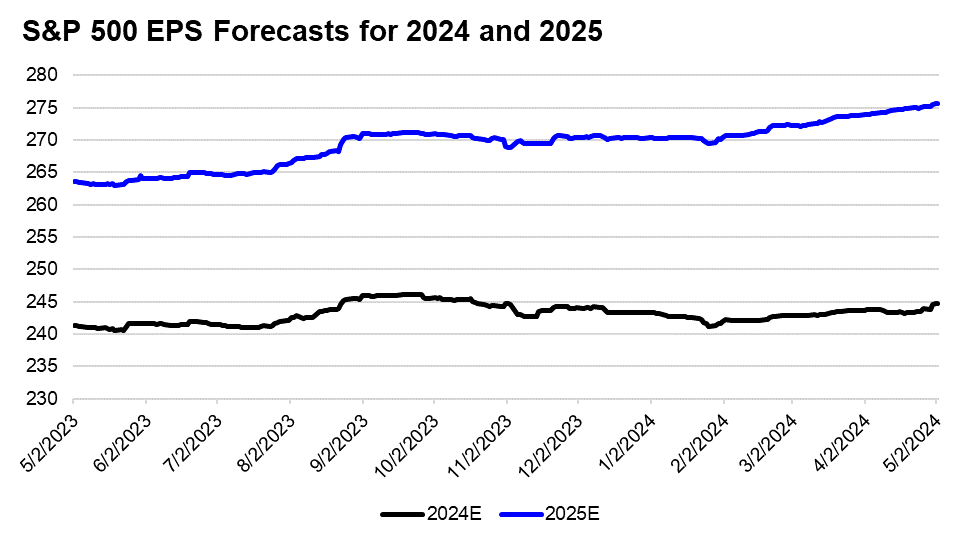
This stationary, “flat is the new up” nature of EPS forecasts has continued in 2024, with little change to S&P 500 forecasts for 2024 earnings. The 2025 EPS estimate has drifted higher by ~2% to $275, which has likely contributed to the broadly risk-on tone in 2024, but there are some fairly lofty assumptions baked into that estimate.
The table below shows the breakdown of S&P earnings estimates. The most important observation is the degree of margin expansion baked into forecasts in order to achieve $275 in 2025.
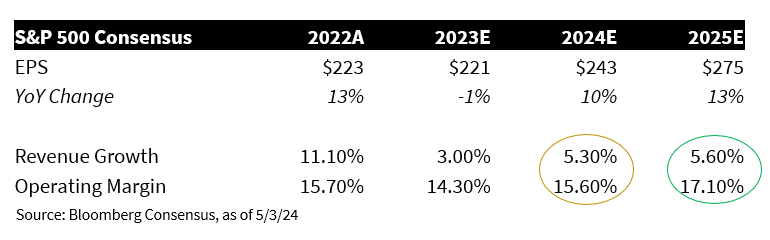
We often say, “don’t bet against the great American might of margin expansion”, however achieving a new record 17.1% operating margin would be an incredible feat without a surge in revenue growth/pricing power/inflation, as the chart below shows.

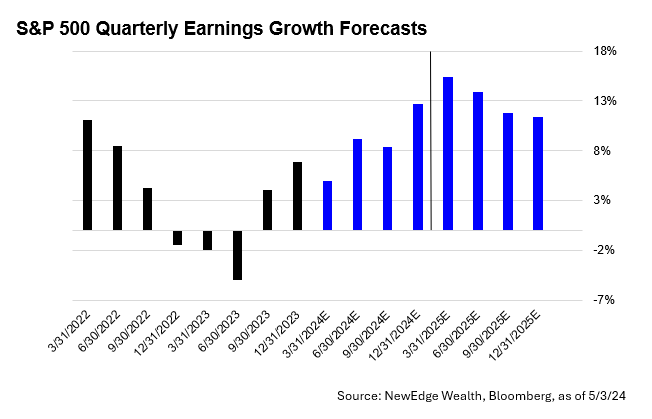
Looking nearer term, we also can observe a high bar for EPS growth in the second half of 2024, where growth is expected to accelerate to +13% by the fourth quarter. As our Jay Peters outlined last week, this is expected to be accomplished without mega growth from the mega cap names, which implies a robust broadening out of earnings power. This is certainly a “show me story”, but for now, analysts are encouraged enough by what they have heard in fourth quarter earnings to keep 2024 estimates static.
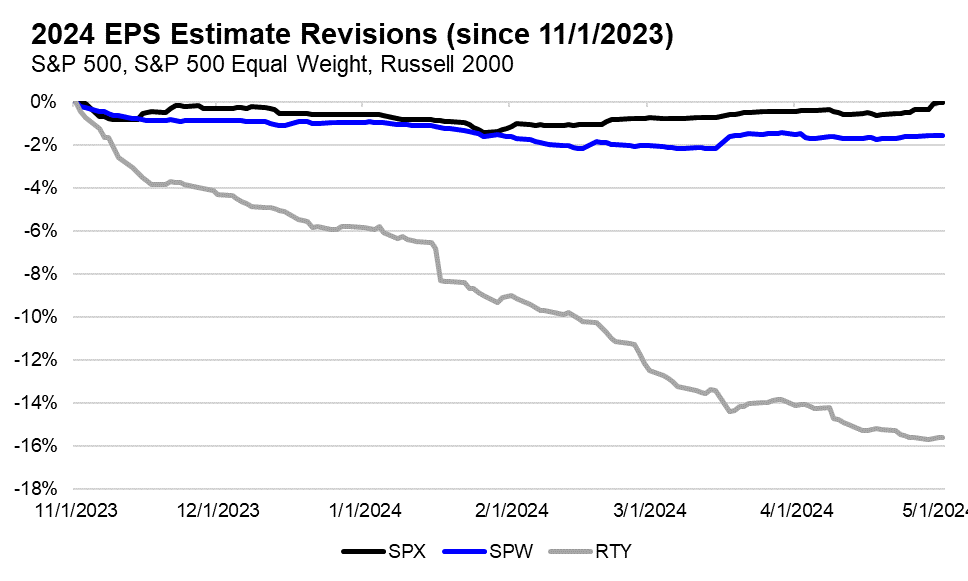
Lastly, we must note that not all indices are created equal when it comes to earnings revisions, with large cap indices performing better than small cap indices. The chart below shows that as the S&P 500 EPS estimates have stayed relatively flat over the last six months, the Russell 2000’s EPS estimates for 2024 have been revised lower by nearly 16% (due to dynamics like higher interest expense), helping to explain the sharp price underperformance of this small cap index.
“So Much More Than Everything”: Conclusion
We think that growth forecasts continue to be “so much more than everything” to risk asset performance, with stable and rising forecasts as the key underpinning of recent risk asset strength. With this, monitoring the sources of potential upside and downside revisions is a critical activity for market participants.
IMPORTANT DISCLOSURES
Abbreviations/Definitions: EPS: earnings per share; GDP: gross domestic product.
Index Information: All returns represent total return for stated period. S&P 500 is a total return index that reflects both changes in the prices of stocks in the S&P 500 Index as well as the reinvestment of the dividend income from its underlying stocks. S&P Equal Weight Index (S&P EWI) is the equally-weighted version of the widely regarded S&P 500® Index, which measures 500 leading companies in leading U.S. industries. The S&P EWI has the same constituents as the capitalization weighted S&P 500® Index, but each company in the S&P EWI is allocated a fixed weight, rebalancing quarterly. Russell 2000 is an index that measures the performance of the small-cap segment of the U.S. equity universe.
[dipl_divi_shortcode id=”40772″]